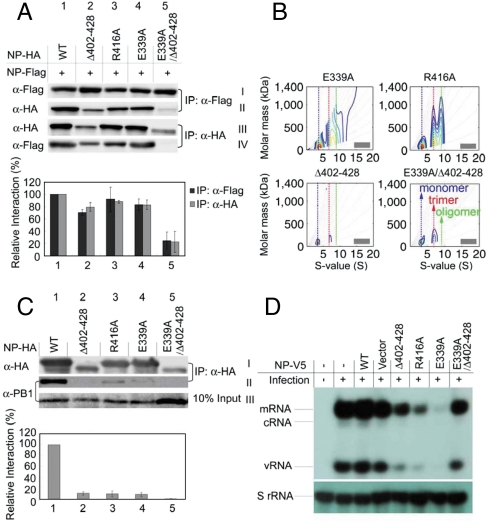
Fig. 2.
IP assays of protein–protein interactions in cells. (A) Interaction of NP-FLAG with NP-HA or mutant-HA. 2 × 10⁶ HEK293T cells were cotransfected with 8 μg of each plasmid. IP analysis was performed 30 h post transfection using total cell extract by anti-FLAG and anti-HA agarose, and visualized by anti-FLAG and anti-HA antibodies. Black bar: row II/row I/row III. Gray bar: row IV/row III/row I. (B) AUC analyses to examine the ability of the NP mutants to mix with WT NP. The complete titration results at 6 different ratios are shown in Fig. S2; only the results of 1∶1 ratio are shown here. Note that different y scales are used in the plots here and in Fig. S2 to show the best comparisons. (C) Pull-down assays for the interaction of NP proteins and PB1. The 2 × 10⁶ HEK293T cells were transfected with 8 μg of each plasmid separately (pClneo-NP-HA or pClneo-mutant-HA) for 24 h, then infected with the WSN virus (MOI = 0.2) for 12 h. IP analysis was performed using total cell extract by anti-HA agarose, and detected by anti-HA and anti-PB1 antibodies. The bar plots represent NP-PB1 interactions: row II/row I/row III. The bar plots are means and SD from three independent experiments. (D) The transcription-replication activity is reduced by NP mutant proteins. MDCK cells were infected with the WSN virus at MOI of 2. RNA was isolated from cells 6 h after infection and analyzed by primer extension assays.

