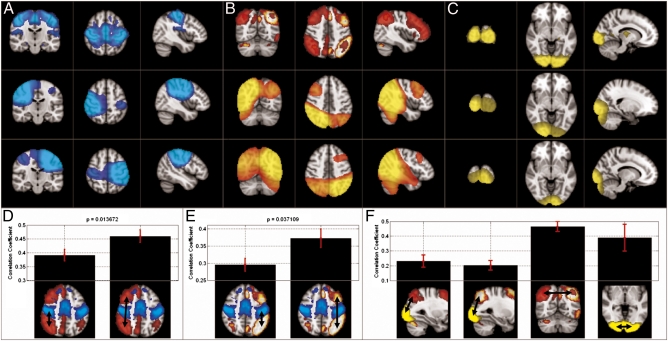
Fig. 2.
MEG seed-based correlation analysis in the β-band. (A) Motor network: Top, fMRI (ICA result); Middle, MEG, right motor seed; Bottom, MEG, left motor seed. (B) FP network: Top, fMRI; Middle, MEG, right parietal seed; Bottom, MEG, left parietal seed. (C) Visual network: Top, fMRI; Middle, MEG, left visual seed; Bottom, MEG, right visual seed. (D and E) Correlation between the parietal and motor areas compared with correlation between parietal and frontal areas in the right (D) and left (E) hemispheres. (F) Comparison between correlation measured between left visual and left parietal, right visual and right parietal, and left/right parietal and left/right visual. In D–F, colored overlays represent the network nodes and are based on fMRI data.

