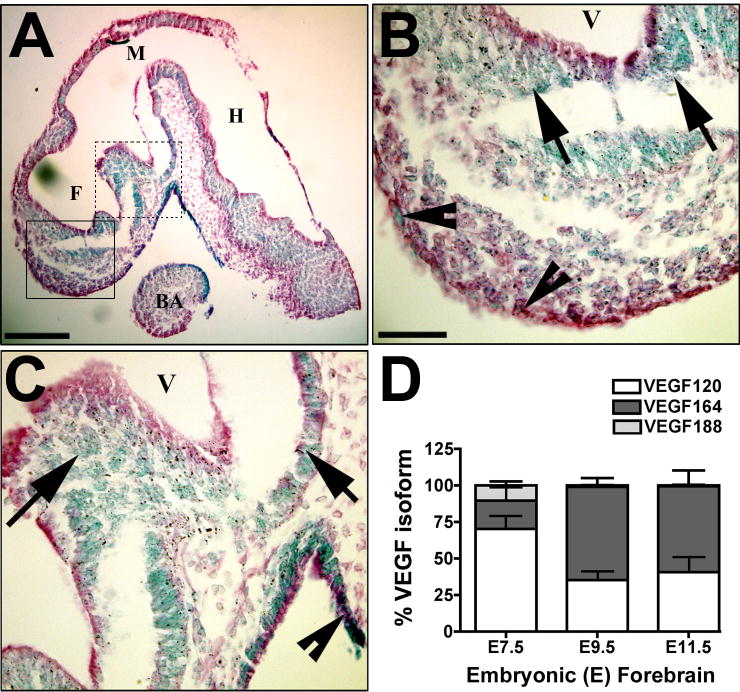
Figure 1. VEGF expression in developing neuroepithelial cells.
(A–D) VEGF-lacZ embryos (E9.5) were stained for β-galactosidase (β-gal) activity, imbedded in paraffin, sectioned in the saggital plane along the midline, and counterstained with eosin. Formation of the secondary vesicles derived from the forebrain (F), midbrain (M) and hindbrain (H) are identified. The first brachial arch mesoderm (BA) is indicated for anatomic reference. The β-gal gene product is targeted to the nucleus (Miquerol et al., 1999), so all VEGF-expressing cells have blue nuclei. Blue nuclei are detected throughout the neuroepithelium. The boxed areas in A are shown in higher magnification in B (solid line) and C (dashed line). Arrows indicate positive nuclei in the neuroepithelium and arrowheads indicate positive cells at the pial surface. The scale bars are 200 μm (A) and 50μm (B–C). (D) Quantitative real-time PCR (qPCR) analysis of the VEGF isoforms, VEGF120, VEGF164, and VEGF188 is graphed as a proportion of the total VEGF mRNA produced for isolated neuroepithelium from E7.5, E9.5 and E11.5 wild-type mice. Data are from 9–11 embryos from 3–5 litters, analyzed at each time point. The mean and standard error of the mean are graphed based on values determined by comparison to an isoform-specific standard curve run in parallel.

