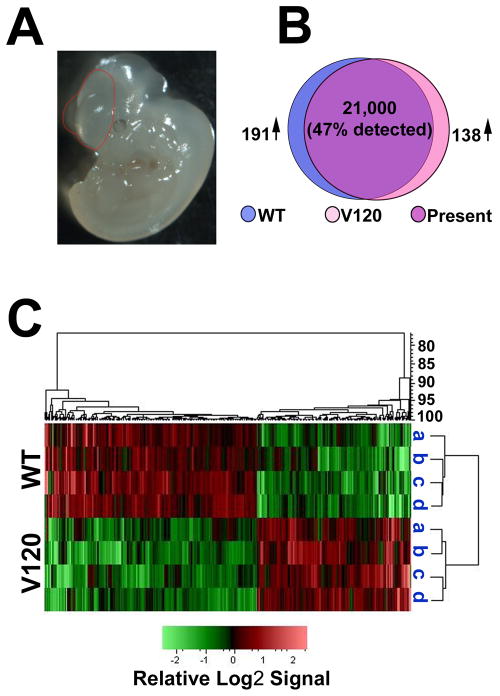
Figure 3. Differential gene expression in wild type and VEGF120 mice at E9.5.
(A) Representative image of an E9.5 embryo with the microdissected region traced in red. The isolated tissue included the forebrain region with the lateral telencephalon pouches and a caudal border of the ingressing diencephalon. (B) Venn diagram illustrating the number of sites detected on the Affymetrix 430.2 mouse chip comparing four each of wild type (WT, blue) and VEGF120 (V120, pink) samples with the region of common expression indicated as present (purple). The number of differentially expressed genes increased in wild type (191↑) and increased in VEGF120 (138↑) are based on ≥1.5 difference and an unpaired t test p value of ≤0.05. (C) The PLIER signals for the differentially expressed genes were transformed to the base 2 log and row mean centered. The heat map shown was generated via unsupervised (unbranched) hierarchical clustering of the samples with relative Log2 signal intensity indicated below. The dendrogram on the right indicates the distance relationships between the clustered samples while the dendrogram above indicates the relationships among the genes.

