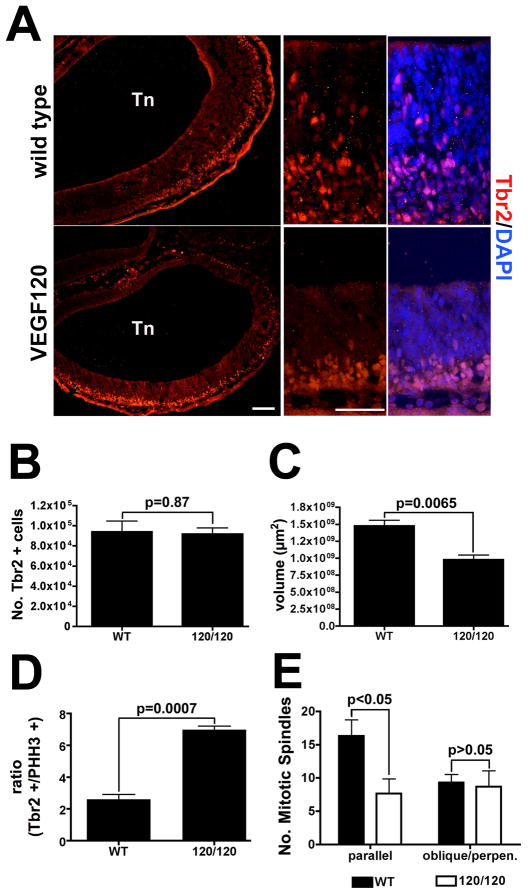
Figure 6. Tbr2-positive intermediate progenitors are preferentially supported relative to neural stem cells in VEGF120 mice.
(A) Immunolabeling for Tbr2 is shown in E11.5 neuroepithelium from the anterior primitive telencephalon (Tn) with the lateral loop shown in low magnification on the left for wild type and VEGF120 (scale bar is 200 μm). The center panel shows Tbr2-immunopositive nuclei (red) with the ventricular surface at the top and the pial surface at the bottom. Positive cells highlight a secondary population of proliferating precursors intermediate between the ventricular zone and the pial surface in wild-type animals. A restricted band of Tbr2-positive cells is identified in the VEGF120 mice. The same area in overlay with DAPI stained nuclei (blue) is show on the right for comparison (scale bar is 50 μm). The samples shown are from littermates and the immunolabeling was repeated three times with similar results. Design-based stereological quantification of Tbr2-positive cells (B) and neuroepithelial volume (C) in wild type versus VEGF120 mice at E11.5. The optical dissector frame was 75 × 75 μm and the counting grid was set at 80 × 80 μm with a counting frame height of 18 μm and 2 μm guard zones on either side. Values shown are mean and SEM for three samples counted with the investigator masked to genotype. The p values for unpaired t tests are shown in the figures. The number of Tbr2-positive cells was then related to the number of PHH3-positive cells in matched animals and expressed as a ratio (D). The ratios were transformed to the natural log and significance tested with an unpaired t test; p values are indicated in the figure. (E) The number of mitotic spindles in a subset of PHH3-positive cells in the anterolateral telencephalon were quantified as parallel or oblique/perpendicular to the ventricular surface reflecting the orientation of the daughter cells after division. The optical dissector frame was 40 × 40 μm and the counting grid was set at 80 × 80 μm with a counting frame height of 18 μm and 2 μm guard zones on either side. The mean and SEM for three embryos is graphed and significance tested with an unpaired t test; p values are indicated in the figure.

