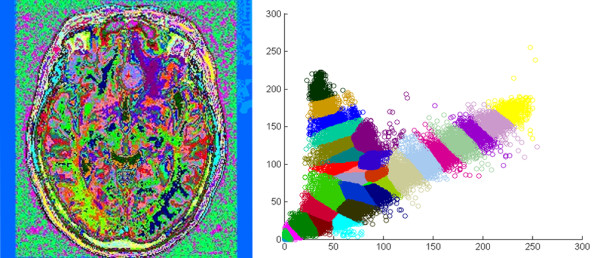
Figure 3.

Result after FCM clustering. FCM clustering on MR images of the brain (left), and the histogram after defuzzification (right), a total of 32 groups of binary image were produced according to the colors zones shown on the histogram, each color represent a particular tissue character.
