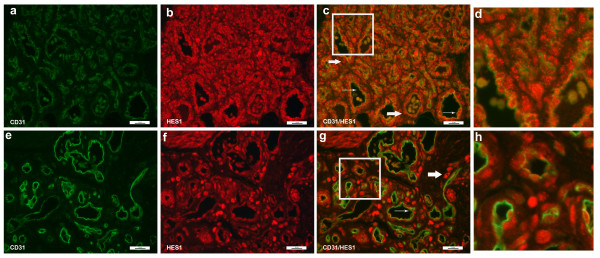
Figure 7.
Immunofluorescence staining of CD31 and HES1. Immunofluorescence staining of CD31 (green) and HES1 (red). Proliferating hemangioma, panels a-c; involuting hemangioma, panels e-g. HES1 was expressed in HemSCs and were localized in the peri-vascular cells (thick arrows, panels c & g). There were occasional endothelial cells that showed nuclear staining of HES1 and cytoplasmic staining of CD31 (thin arrows, panels d & f). Magnification, 40×. Panels d, h: close up of Figure 7c (proliferating hemangioma) and 7g (involuting hemangioma). There were occasional endothelial cells that expressed HES1 (red nuclei with green cytoplasm, thin arrows), while the majority of HES1+ cells (red nuclei) were located in non-endothelial perivascular cells.

