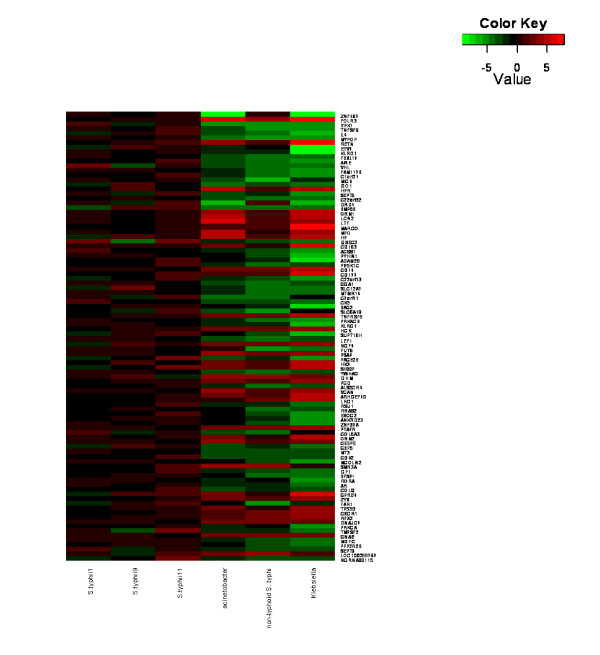
Figure 1.
Distinct transcriptional profiles of S. Typhi patients. A heatmap of differentially-expressed genes showing distinct transcriptional profiles of S. Typhi patients compared with patients with Acinetobacter, non-typhoidal salmonella or Klebsiella infection. Red indicates over-expressed transcripts and green represents under-expressed transcripts.

