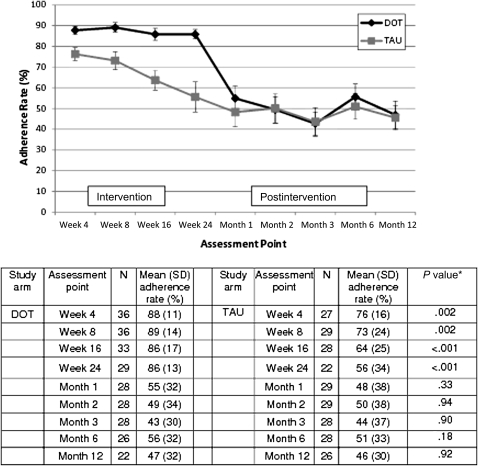
Figure 1.
Differences in mean adherence rates between human immunodeficiency virus–infected participants in the directly observed therapy (DOT) group and those in the treatment as usual (TAU) group at each assessment point during both the 24-week intervention and the 12-month postintervention follow-up period. Fewer than 65 observations may be reported due to missing data. *P values for weeks 4, 8, 16, and 24 are based on mixed-effects models that include pill count adherence data from the 24-week intervention period; P values for months 1, 2, 3, 6, and 12 are based on mixed-effects models that include composite adherence data from the 12-month postintervention period.

