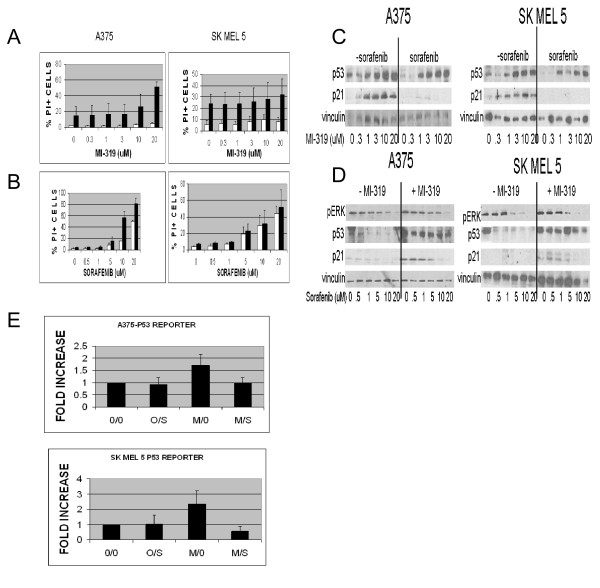
Figure 1.
(A and B). Induction of apoptosis in A375 and SKMEL5 cell lines treated with (A) variable concentrations of MI-319 with (black bars) or without (white bars □) 10 μM sorafenib or with (B) variable concentrations of sorafenib with (black bars) or without (white bars □) 20 μM MI-319. Data are presented as the percentage of total cells staining positive for propidium iodide. (C and D). p53 and p21waf levels in A375 and SKMEL5 cell lines treated with (C) variable concentrations of MI-319 with or without 10 μM sorafenib or with (D) variable concentrations of sorafenib with or without 20 μM MI-319. (E). p53-luciferase reporter activity in transfected A375 and SKMEL5 cells treated with 10 μM sorafenib (S) and/or 20 μM MI-319 (M) for 6 hours. Data are presented as fold increase relative to the activity in the untreated control cells.

