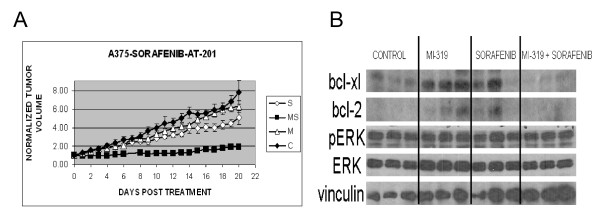
Figure 6.
Antitumor effects of sorafenib and MI-319 on A375 melanoma xenografts. (A). Growth curves of A375 xenografts from mice treated with control vehicle (C), sorafenib (S), MI-319 (M), or both drugs (MS). Data is presented as tumor volume relative to tumor volume when treatment started. (B). Western blot analyses of whole tumor lysates prepared from tumors excised on day 21.

