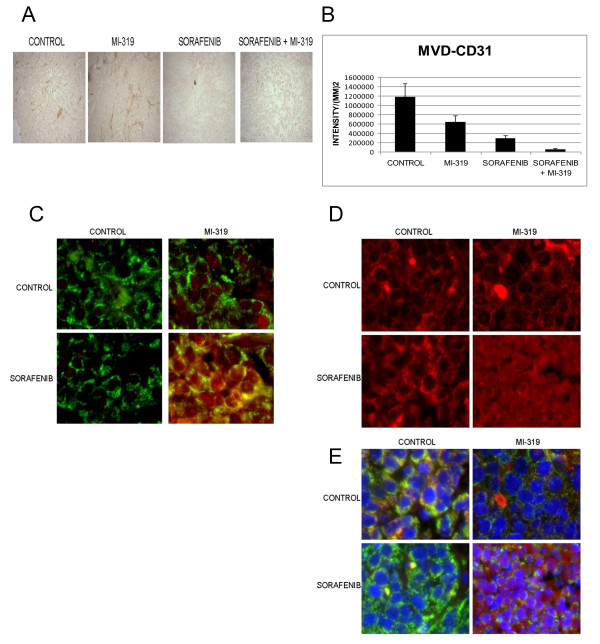
Figure 7.
(A) Effect of MI-319 and sorafenib on microvessel density in A375 xenografts. Tumors were stained with CD31. A. A representative tumor section from each treatment group is shown. (B) Endothelial cells were quantitated using Image Pro 6.0 software. Each bar graph is representative of 6 tumors. (C). Immunofluorescence microscopic evaluation of p53 (red) in tumor cells from A375 xenografts. Drug treatment was as indicated in the figure. COX4 (green) was used as a mitochondrial marker in this study. (D). Immunofluorescence microscopic evaluation of AIF (red) in tumor cells from A375 xenografts. Drug treatment was as indicated in the figure. (E). Immunofluorescence microscopic evaluation of AIF in tumor cells from A375 xenografts. All colors are shown here (i.e. blue = Hoescht (Bisbenzimide H33342) stain, green = COX4, AIF = red). Drug treatment was as indicated in the figure.

