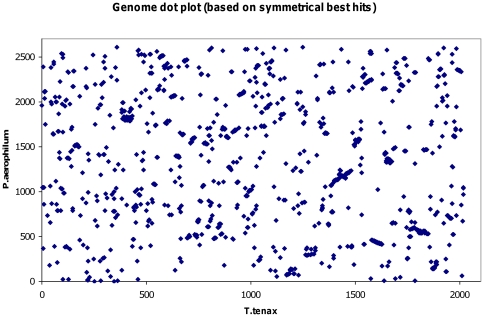
Figure 3. Genome dot plot comparison of T. tenax and P. aerophilum.
CDSs in genomic order were tested for colinearity between the two genomes of T. tenax and P. aerophilum. Each point represents a matching pair of orthologs with an e-value of <1×e−15 (for approach see material and methods). The calculations yielded a value for C (colinearity factor) of 280. The comparison of bacterial genomes of similar size yielded values in the range of 18 (Helicobacter pylori J99 vs H. pylori 26695) to 238 (Helicobacter acinonychis vs Wolinella succinogenes) [119]. The very limited synteny between the genomes of T. tenax and P. aerophilum that keeps only the gene order of local islands intact, suggests major genomic rearrangements after their divergence from the common ancestor.

