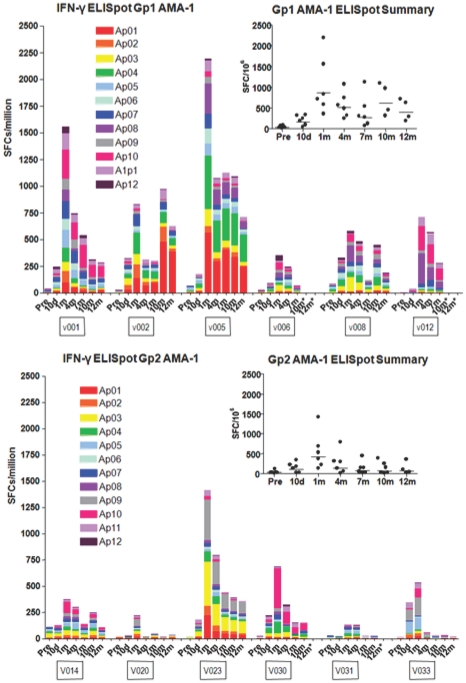
Figure 6. ELISpot activity of serial bleeds of volunteers in Group 1 and Group 2 with AMA1 peptide pools.
The ELISpot activities of each volunteer at pre-immunization, 10 d and 1, 4, 7, 10 and 11–12 m are displayed using color-coded AMA1 peptide pools Ap1–Ap12. The inserts show the values of the sum of each volunteer's responses at each time point and the bar indicates the geometric mean of the group. At 1 month, geomean values were higher (862 sfc/m PBMC's) in the low dose Group 1 than the high dose Group 2 (422 sfc/m PBMC's).

