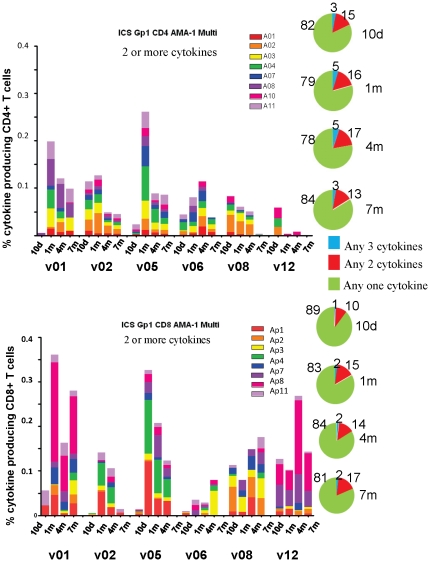
Figure 10. Multifunctional CD4+ and CD8+ T cells of serial bleeds of volunteers in Group 1 with AMA1 peptide pools.
A and C: Multifunctional (any two cytokines) CD4+ and CD8+ T cell activities of each volunteer at 10 d, 1, 4, and 7 m after immunization (subtracting pre-immunization values) are displayed using color-coded AMA1 peptide pools. At 1 month, CD4+ multi responses (geomean 0.072% CD4+ T cells, std dev 94) and CD8+ multi responses (geomean 0.13% CD8+ T cells, std dev 14) were similar. B and D: Pie charts representing the proportion of the cytokine response indicated by cytokine subsets as shown; numbers on pie charts represent per cent of that subset of the total cells.

