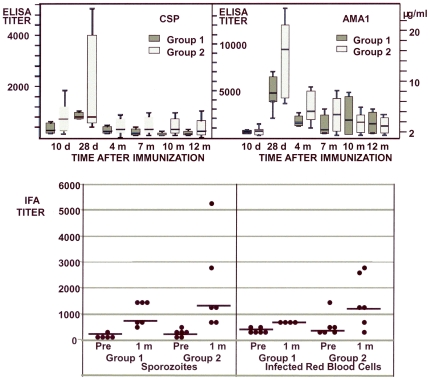
Figure 11. Group 1 and Group 2 anti-CSP and AMA1 antibody responses by ELISA and IFA.
A and B: Box plots of the means and 25% and 75% percentiles of each group at 10 d and 1, 4, 7, 10 and 11–12 m after immunization. The first and third quartiles are the top and base of each box, and the upper and lower bars represent the high and low values respectively. C: IFA titers of each group pre-immunization and at 1 month post-immunization against sporozoites (left panel) and infected red blood cells (right panel). Bars represent geomeans.

