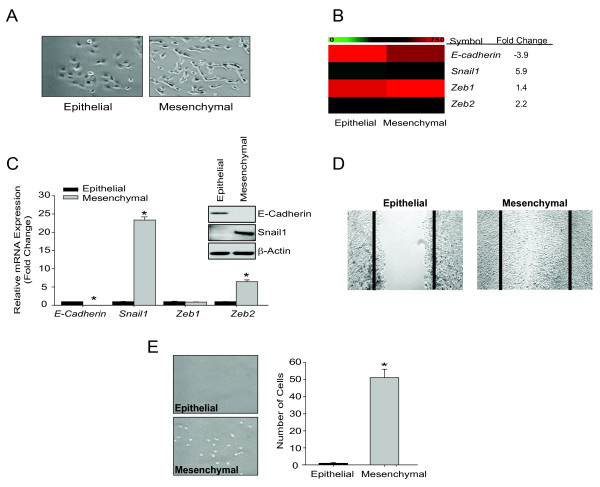
Figure 1.
Murine epithelial and mesenchymal liver cancer cells. (A) Representative phase-contrast images (10 × magnification) of epithelial and mesenchymal cells. (B) Heatmap of mesenchymal markers generated from raw microarray values. (C) Relative expression of mRNAs endcoding E-cadherin, Snail1, Zeb1 and Zeb2 normalized to endogenous control Gapdh. Bars represent mean ± SEM of triplicates, *p < 0.01. Western blot analysis of E-cadherin, Snail1, and β-actin. Data representative of two independent experiments. (D) Wound healing assay. Bars represents mean ± SEM of triplicates, *p < 0.01. (E) Matrigel invasion assay. Phase-contrast images (4 × magnification) of cells that have invaded the membrane and adhered to the bottom of the plate. Data are expressed as the total number of invasive cells at the bottom of the plate, with five fields counted per well, n = 3 wells/cell line, and reported as the mean ± SEM, *p < 0.01.

