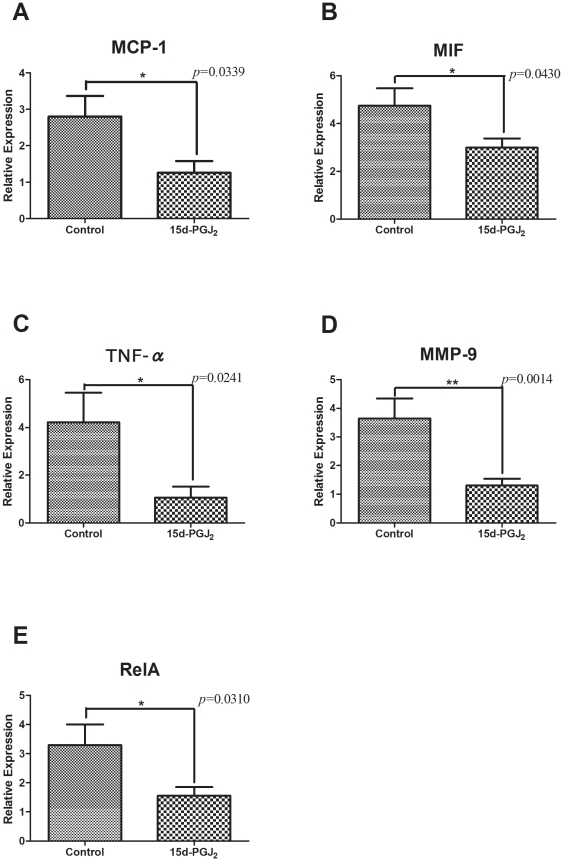
Figure 5. Comparison of gene expressions in the thoracic aorta between the control and 15d-PGJ2 treated groups by real-time PCR analysis.
Apo E-knockout mice were fed a Western-type diet and treated with PBS (control group) or 1 mg/kg/day 15d-PGJ2 (15d-PGJ2 group) for 2 mo. Thoracic aortae were removed and total RNA was extracted from them. cDNA was synthesized by reverse transcription, and quantitative real-time PCR was performed. The relative gene expression values were calculated. The relative expressions were significantly decreased in the 15d-PGJ2 group, MCP-1 (1.263±0.3193 vs 2.802±0.5627, p = 0.0339) (A), MIF (2.985±0.3860 vs 4.745±0.7347, p = 0.0430) (B), TNF-α (1.059±0.4625 vs 4.220±1.236, p = 0.0241) (C), MMP-9 (1.304±0.2344 vs 3.644±0.6947, p = 0.0014) (D) and RelA (1.551±0.2995 vs 3.294±0.7093, p = 0.0310) (E), compared with in the control group. *p<0.05, **p<0.01, with Student's t test.

