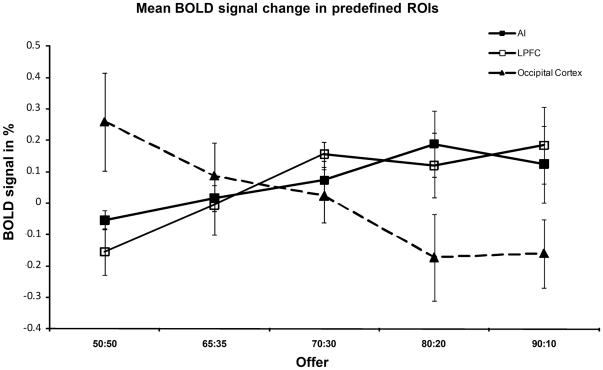
Figure 8. Mean fMRI signal differences in the ROIs used in the online UG to predict acceptance vs. rejection for the five types of offers.
Differences were calculated between 1st to 2nd and 3rd to 5th scan after the offer and averaged over the seven participants. Bold signal in AI (slope linear fit 0.062, p<0.05) and LPFC (slope linear fit 0.11, p<0.05). In contrast, signal decreases in OC when the likelihood of acceptance decreases (slope linear fit −0.16, p<0.05).

