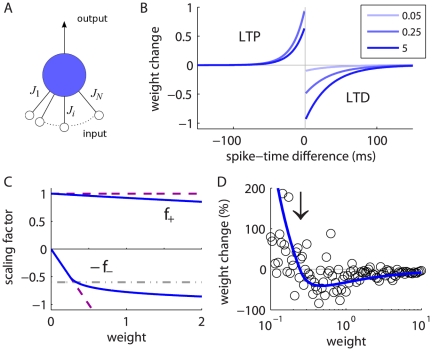
Figure 1. Single neuron equipped with STDP-plastic synapses.
A: Single neuron excited by  input spike trains. The synaptic strength of synapse
  is denoted by
  . B: Potentiation (LTP) and depression (LTD) curves
  with
with  in (4). Darker curves indicate stronger values for the weight
  :
:  (light blue),
  (medium blue), and
  (dark blue) in (6). In the top left quadrant for LTP, the two curves in lighter blue are superimposed, since potentiation is quasi-constant for small weights. C: Functions
  for LTP and
  for LTD in log-STDP (blue solid curve) in (6) with
  ,
,  and
and  ; mlt-STDP similar to van Rossum et al.'s model [24] (pink dashed line); and add-STDP similar to Song et al.'s model [1] (gray dashed-dotted curve for depression and pink dashed curve for potentiation). D: Weight change (in percent of the original weight) resulting from 20 successive modifications induced by log-STDP with random pairing of pre- and postsynaptic spikes (within the range
  ms). In qualitative agreement with experimental measurements [19], smaller weights experience large fluctuations whereas larger weights exhibit less variability. The mean expected modification (blue solid curve) and
  is indicated by the vertical arrow.

