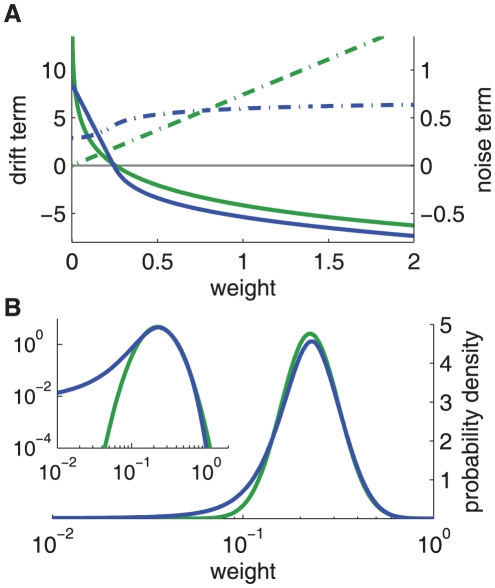
Figure 2. Comparison between the toy model and our new model of log-STDP.
A: Plot of the functions  (solid curves, left y-axis) and
  (dashed-dotted curves, right y-axis) that describe the first and second moments of the weight dynamics, cf. (1). Comparison between log-STDP (blue curves) with
  ,
,  ,
,  ,
,  ,
,  ,
,  ,
,  ms in (3), (4) and (6); and the toy model (green curves) with
  ,
,  ,
,  , and
, and  in (22). B: Solutions of the Fokker-Planck equation for the curves plotted in A. The x-axis has a log scale. Left inset: log scales for both axes.

