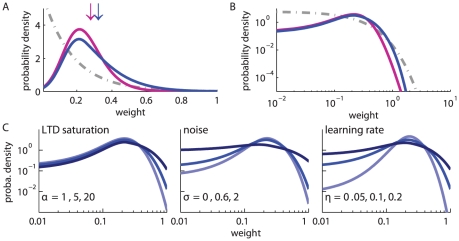
Figure 3. Theoretical predictions of weight distribution shaped by STDP.
A: Resulting weight distribution for log-STDP (blue solid curve) with the saturation for LTD corresponding to  in (6); mlt-STDP inspired by the model of van Rossum et al. [24] (pink solid curve) in (27); and add-STDP [1], [14] (gray dashed-dotted curve) in (26). Log-STDP and mlt-STDP are parameterized to obtain roughly the same equilibrium value for the mean weight (arrows); without noise and very slow learning, the resulting narrow distribution would be centered around the fixed point
  . The curves are evaluated using (1) and (5) with the same learning rate
  and noise level corresponding to
  in (3). B: Similar to A with log-scaled axes. C: Effect of the parameters in log-STDP. Comparison between the predicted weight distributions with the baseline parameters
  ,
,  and
and  in (6) (medium blue curve in B) and two variants with the parameter change indicated in each plot (darker curves correspond to larger values).

