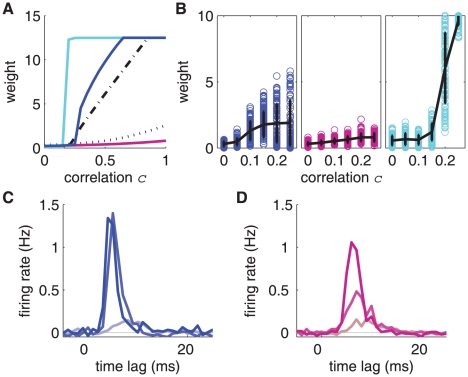
Figure 6. Sensitivity to input correlations.
A: Theoretical equilibrium weights plotted as a function of the input correlation. Comparison of log-STDP (blue), mlt-STDP (pink), nlta-STDP (cyan), Hennequin et al.'s model [22] (dashed-dotted black) and ‘power-law- STDP of Morrison et al. [26] (dotted black). The parameters for the Poisson neuron and the last two models are the same as Fig. S1. The curves are estimated using the zeros of (20), which is based on the Poisson neuron and also neglects the effect of noise. B: Simulated potentiated weights as a function of the input correlation for the same configuration as in Fig. 5B and D. Comparison of log-STDP (blue), mlt-STDP (pink) and nlta-STDP (cyan). The respective mean weights and standard deviations are represented by the black curves and error bars. The results are taken from 10 simulations. C & D: Post-stimulus time histograms of the output neuron after training (averaged over 100 s), where the stimuli are the input correlated events. Comparison between C log-STDP (blue) and D mlt-STDP (pink) for  ,
,  and
and  (from darker to lighter color, resp.). For log-STDP, the neuronal response is reliably and precisely triggered by correlated events (more than 80% occurrence) for
  , whereas mlt-STDP yields 70% for
  and only 50% for
  .
.

