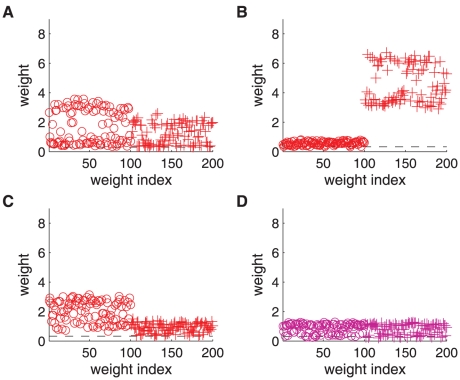
Figure 7. Competition between two identical strongly correlated input pools.
The configuration is similar to Fig. 5 with two groups of 100 correlated inputs each with the same strength  , in addition to 2800 uncorrelated inputs. A: Winner-share-all for
  and log-STDP with
  . B: Winner-take-all for
  and log-STDP with
  . C: Winner-take-all for
  and log-STDP with
  . D: Winner-share-all for
  and mlt-STDP. The circles and pluses indicate the weight strengths averaged values over 300 s of simulation (after the initial development of the structure) for the two correlated groups, respectively. The dashed line indicates the fixed point
  of the weight dynamics.

