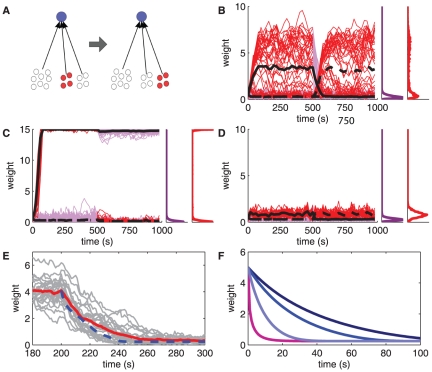
Figure 8. Remodeling of synaptic weights when the input configuration changes.
A: Schematic representation similar to Fig. 5A for two groups of 50 inputs each, which exhibit strong spike-time correlations ( , represented by the bottom red filled circles) only between 0 and 500 s for the first group and between 500 and 1000 s for the second group. B,C,D: Comparison of the evolution of the synaptic weights for B log-STDP (baseline parameters); C add-STDP with a ratio between depression and potentiation equal to
  and an upper bound set to 15; and D mlt-STDP where depression is linearly increasing with the current value of the weight strength (
 and
and  ). These three plots are similar to Fig. 5B, except that red traces indicate weights coming from correlated inputs only when correlation is turned on (purple otherwise). The black thick solid and dashed curves represent the respective mean weights for the first and second correlated groups, respectively. E Decay of potentiated weights back to the baseline equilibrium value (
 ) after input correlation is switched off. Simulated weights are represented by gray traces and their mean by the red thick curve. The theoretical prediction in (7) is plotted in dashed-dotted blue. F Comparison of the predicted decay of potentiated weights for mlt-STDP (pink) and log-STDP for
  ,
,  and
and  (light to dark blue, resp.). The curves correspond to (7), where
  is calculated using the Poisson neuron model.

