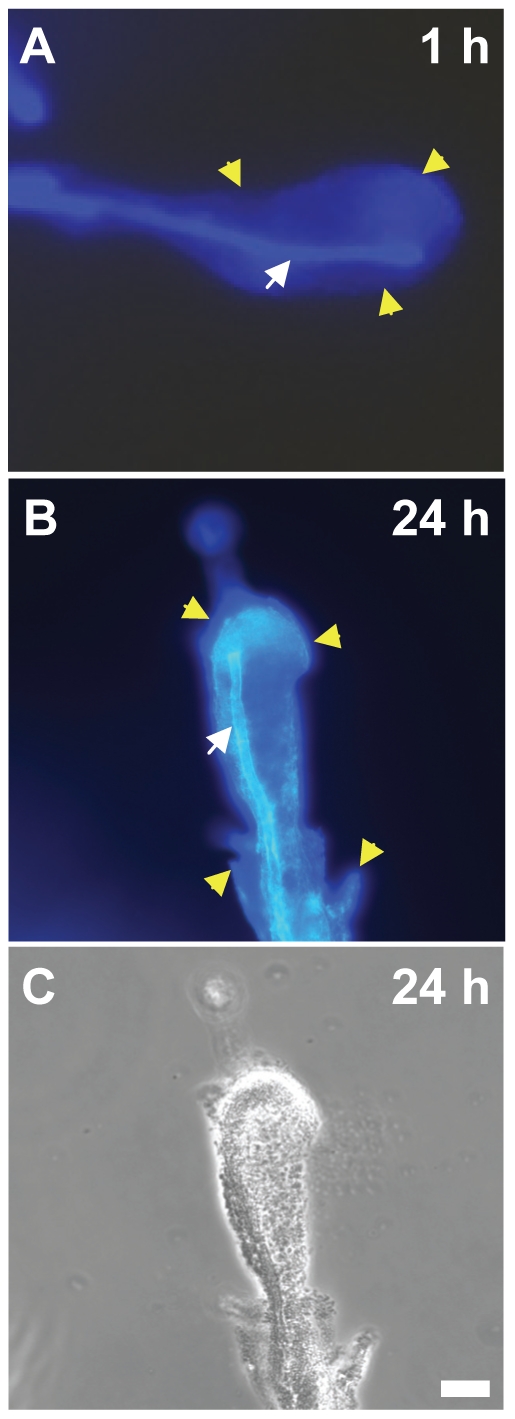
Figure 4. Detection of cellulose in biofilms on A. niger.

Micrographs of S. Typhimurium biofilms on the fungal hyphae after 1 h (A) and 24 h (B and C) of co-incubation. Top and middle panel images show the fluorescence emitted from the chitin in the fungal cell wall (white arrows) and from the bacterial cellulose present in the biofilms (yellow arrows) after staining with Calcofluor White and UV illumination. Figure C is a phase contrast version of the epifluorescence image shown in B. Scale bar, 20 µm.
