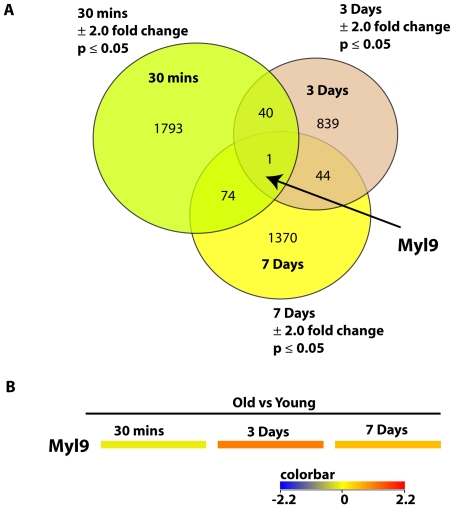
Figure 1. Differentially expressed genes overlapping in multiple time points in old versus young injured rat iliac arteries.
A. Venn diagram shows the number of differentially expressed genes determined by our analysis of 3 different time points in old versus young injured rat iliac arteries. Gene lists were compared to find common differentially expressed transcripts. A 2.0 fold change and p<.05 significance cut-offs were used. No multiple correction was employed. B. Heat map of Myl9 gene expression levels in multiple time points in old versus young injured rat iliac arteries. Myosin Light chain 9, Myl9, was significantly downregulated at 30 mins (−2.2 fold), highly upregulated at 3 days (4.6 fold), and upregulated at 7 days (2.9 fold). Color bar shown in Log2.

