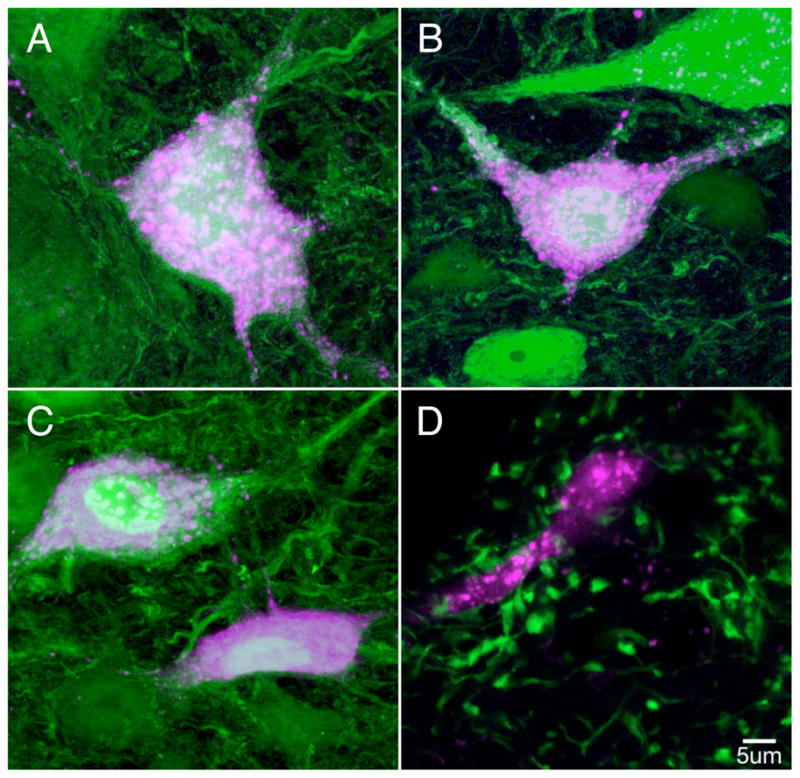
Figure 1.

Two transgenic mouse lines define populations of projection and interneurons in the MVN. A-C: Neurons expressing fluorescent protein in the YFP-16 mouse line (green) were retrogradely labeled from stereotaxic dye injections (purple) into the thalamic parafascicular nucleus (A), the medullary reticular formation (B), and the oculomotor nucleus (C). The neurons shown are representative cases; several neurons were double labeled in multiple sections from 2–3 injections in each target structure. In panel D, fluorescent terminals in the GIN mouse line are labeled in green and are in close apposition to the proximal dendrite of a neuron retrogradely labeled from the cerebellar flocculus (purple).
