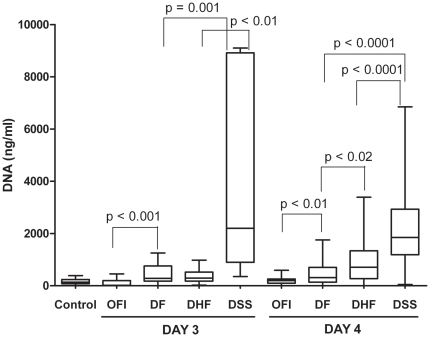
Figure 1. Circulating DNA levels among study groups according to the day of the blood test.
Day 3 and 4 indicate the duration after the onset of high grade fever. Box-plots graphs extend from the 25th to the 75th percentile, and the line at the middle is the median. The error bars extend down to the lowest value and up to the highest. (The outliers are not shown). The Mann-Whitney test was used for comparisons of DNA levels between groups.

