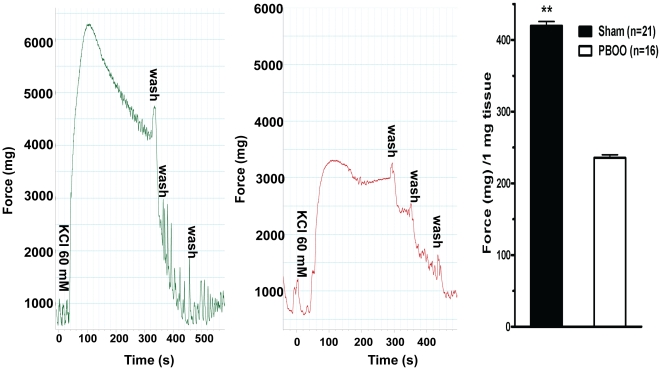
Figure 2. Rat bladder smooth muscle in vitro contractility in response to KCl.
Left (sham) and middle (PBOO) panels are typical tracings. The x-axis represents time (s) while the y-axis represents force (mg). Accordingly, right panel is summary graph for the representative data shown in left and middle panels. Responses were normalized to strip weight. Values are expressed as mean ± SEM. ** = p<0.01 vs PBOO. (n = strips obtained from 25 different animals, one to two strips were used for each animal).

