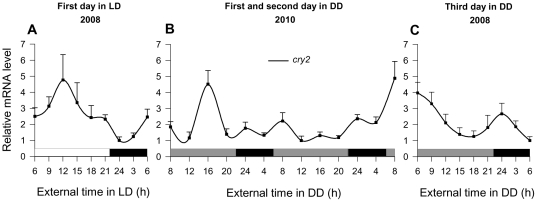
Figure 1. Oscillatory rhythms of cry2 in krill.
Transcript levels of cry2 in krill heads were measured by quantitative PCR from two independent time course experiments, in 2008: Full 24 hour cycle under (A) light-dark (LD) conditions and (C) at the third consecutive day in constant darkness (DD), and 2010: Full 48 hour cycle at the first and second consecutive day in DD (B). Significant oscillations were observed in LD conditions (24 h period with p<.01, CircWave see material and Methods) and at the third day in DD (∼18 h period with p<0.05). Fisher's LSD post-hoc analysis of cry2 oscillatory rhythms indicate the following significant (p<0.05) differences among time points: cry2 expression under LD conditions at 9:00, 12:00, and 15:00 h was significantly elevated compared to expression at 6:00, 18:00, 21:00, 24:00, and 3:00 h, and expression at 24:00 and 3:00 h was significantly reduced compared to expression at 6:00, 9:00, 12:00, 15:00, 18:00, and 21:00 h; cry2 expression during the first day in DD at 16:00 h was significantly elevated compared to expression at 8:00, 12:00, 20:00, 24:00, and 4:00 h, and expression at 8:00 h (second time point) was significantly elevated compared to expression at 12:00, 20:00, 24:00, and 4:00 h; cry2 expression during the second day in DD at 8:00, 24:00 and 4:00 h was significantly elevated compared to expression at 12:00, 16:00, and 20:00 h, and expression at 8:00 h (second time point) was significantly elevated compared to expression at 8:00 (first time point), 12:00, 16:00, 20:00, 24:00 and 4:00 h; cry2 expression during the third day in DD at 6:00 (first time point), 9:00, and 24:00 h was significantly elevated compared to expression at 12:00, 15:00, 18:00, 21:00, 3:00, and 6:00 h (second time point). White and black bars refer to light and dark periods. Grey bars refer to the previous light periods. Shown are means ± SEM (n 3–7).

