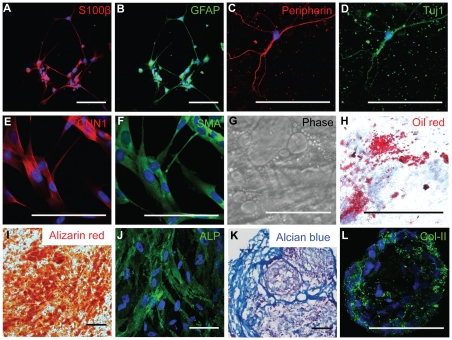
Figure 1. In vitro differentiation potential of NCSCs.
(A–B) Immunostaining for Schwann cell markers S100β (A) and GFAP (B). (C–D) Immunostaining for peripheral neuron markers peripherin (C) and Tuj1 (D). (E–F) Immunostaining for SMC lineage markers CNN1 (E) and SMA (F). (G–H) Adipogenic differentiation shown by phase contrast imaging (G) and Oil red staining (H). (I–J) Osteogenic differentiation shown by Alizarin red staining for calcified matrix (G) and immunostaining of alkaline phosphatase (ALP) (H). (K–L) Chondrogenic differentiation shown by Alcian blue staining for glycosaminoglycans (E) and immunofluorescent staining of Col-II (F). In all immunofluorescence images, nuclei were stained by DAPI in blue. Scale bar = 100 µm.

