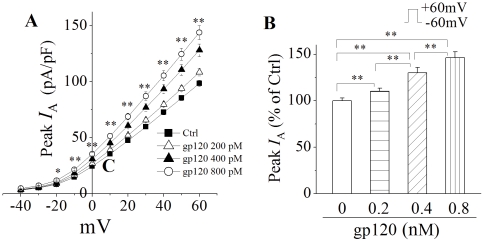
Figure 3. gp120 increased neuronal I A in a dose-dependent manner.
Panel A illustrates the I–V plots of I A current densities in the absent and present of gp120 at different concentrations indicated. * p<0.05, ** p<0.01, gp120 200 pM (n = 115), 400 pM (n = 63), 800 pM (n = 57) vs Ctrl (n = 128), respectively. Panel B is a bar graph showing the average percentage of gp120-induced increase of neuronal I A when the instantaneous peak currents generated in response to +60 mV voltage step were measured. ** p<0.01 as indicated.

