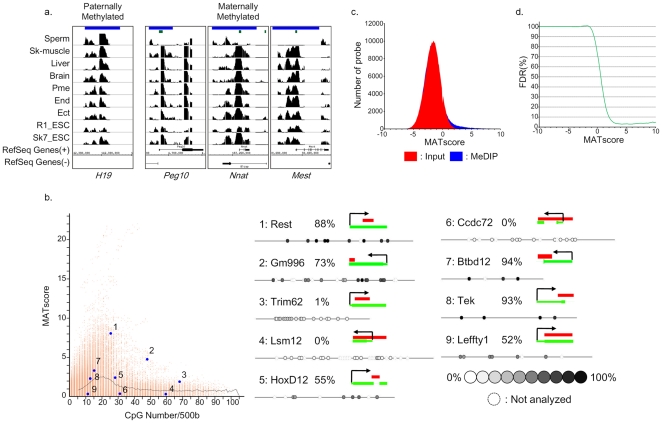
Figure 1. Defining the promoter methylome.
a) Microarray detection of DNA hypermethylation on imprinting center regions (ICRs). A green line indicates a CpG island region. A blue line indicates an ICR. b) (left panel) Scatter plots show the DNA methylation levels for all probes relative to their CpG content (CpG/bp). Each spot represents one probe. (right panel) Quantification of DNA methylation for a subset of probes (left panel). The red line indicates the region amplified for bisulfite sequencing. CpGs are represented as open dots (if unmethylated) or filled dots (if methylated). The percentage of CpG methylation is indicated for each amplicon. c) The MATscore distribution of array regions corresponding to INPUT (red) and MeDIP (blue). d) The FDR (%) distribution corresponding to each MATscore.

