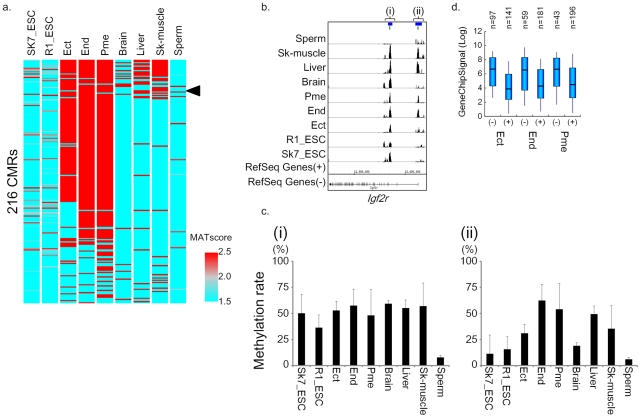
Figure 4. Methylation changes in cells derived from mouse ES cells and mouse adult tissues.
a) Overview of variable DNA methylation profiles among the three germ layers. The arrowhead indicates ectodermal relaxation of DNA methylation of Igf2r. b) DNA methylation profile and schematic representation of the Igf2r imprinting region. A green line indicates a CpG island region. A blue line indicates an imprinting center region (ICR). c) Validation of DNA methylation in the Igf2r imprinting region. (i) indicates the normal imprinting region, and (ii) indicates the ectodermal relaxation of DNA methylation. The DNA methylation level was quantitatively estimated using MALDI/TOFMS. d) Expression levels of variable methylation-associated genes for each sample. Pair-wise comparisons of expression levels of methylated or hypomethylated genes were performed using a t-test.

