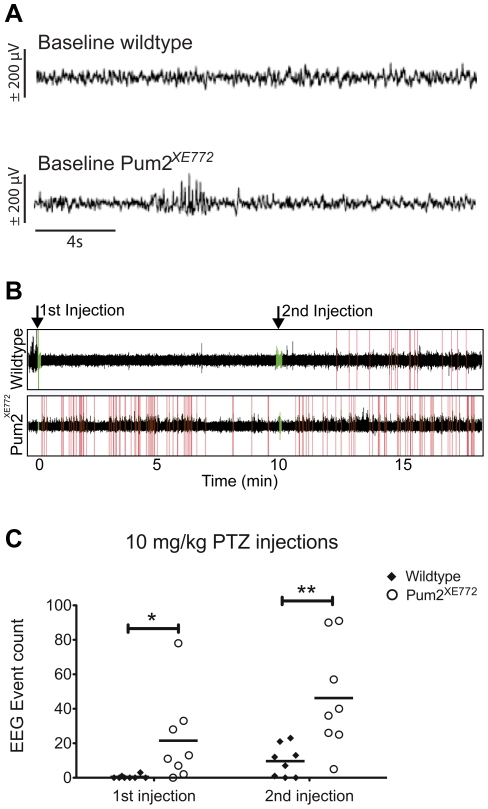
Figure 4. PTZ seizure screen (10 mg/kg bodyweight).
(A) Representative EEG samples in baseline in a wildtype (top) and a Pum2XE772 mouse (bottom). Traces represent 20 seconds of EEG recordings (200 Hz sampling rate, 0.7–50 Hz band filtering). Abnormal EEG events, characterized by short lasting (2 seconds) 5–7 Hz bursts, are seen in 50% of KO mice and never occur in WT mice. (B) Representative example of an event count for one wildtype (top) and one Pum2XE772 mouse (bottom) after injection of 10 mg/kg PTZ. Injection times are marked with green (arrows), counted events in red. (C) Pum2XE772 mice have significantly higher numbers of EEG events both after the first injection of 10 mg/kg PTZ and after a second injection 15 minutes later (*p<0.05, **p<0.01).

