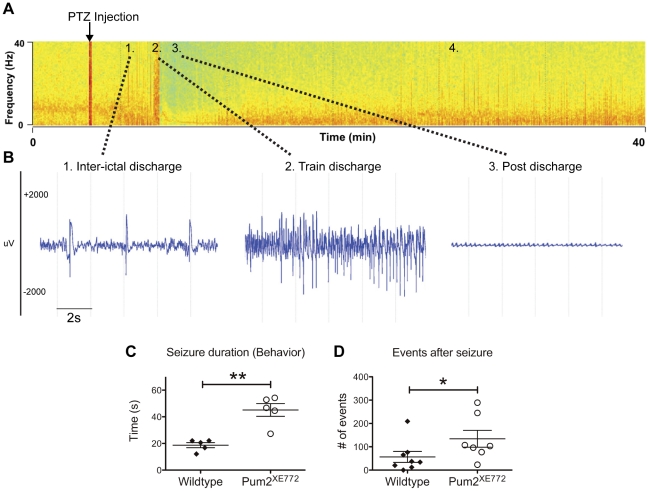
Figure 5. PTZ seizure screen (45 mg/kg bodyweight).
(A) Actual color-coded spectral analysis (EEG power vs. frequencies in ordinate and time in abscise) of a Pum2XE772 EEG. Spectral analysis was performed using a FFT (1024 Hz) on 4 seconds epochs and EEG power per frequency bin was subsequently color coded as high in red, intermediate in yellow and low in green, allowing the visualization of abnormal EEG events of high intensity (red lines). A single 45 mg/kg PTZ injection (arrow) induces typical interictal discharges within 15 min (1.), followed by a paroxysmal episode of train discharges (2.) and a post discharge episode characterized by low intensity EEG (postictal period, 3.). After approx. 20 min the EEG is normalized but discharges are still seen for several hours (4.). (B) Actual EEG samples of zone 1. (interictal discharges), 2. (train discharges) and 3. (postictal EEG). Of note, discharges occurring in zone 4. (recovery) are of the same nature as discharges in zone 1. (C) Quantification of behavioral events: Pum2XE772 mice have significantly longer tremor duration (body twitches and jerks) during the postictal period compared to wildtype mice. Despite a flat EEG, Pum2XE772 mice had increased behavioral manifestations. (D) Quantification of discharges during a 3-hour period after EEG recovery (red lines in A, 4.). Pum2XE772 mice have significantly more abnormal EEG events following the tonic-clonic seizure (*p<0.05, **p<0.01).

