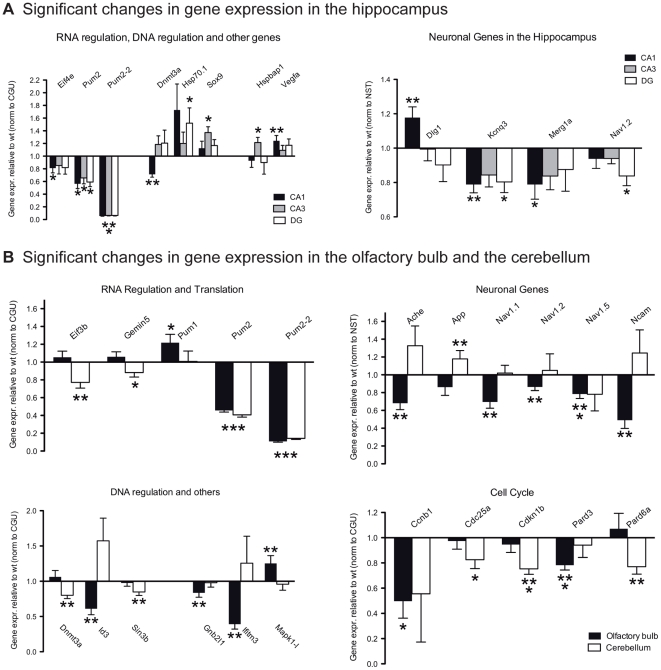
Figure 6. Gene expression in the brain.
Data are normalized to the housekeeping genes Ctnnb1, Gapdh and Ubc (CGU) or the neuron-specific genes Eno2, Syp and Tubb3 (NST). The graphs show fold difference of Pum2XE772 tissue compared to wildtype. Plotted are only genes with expression levels significantly different from wildtype tissue (Mean ± SEM, *p<0.05, **p<0.01, ***p<0.001).

