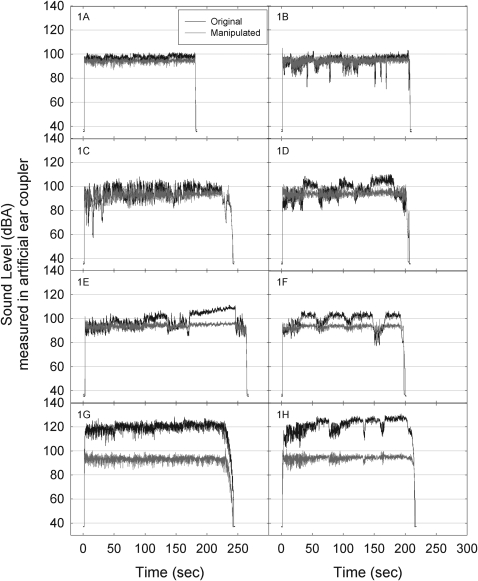
Figure 1.
(Color online) Time-level plots for exemplar songs are shown here. Songs levels shown here were measured using Brüel & Kjær type 4157 artificial ear simulators, with right and left earphones simultaneously measured using separate 4157 devices. Songs selected to be shown here were chosen to specifically illustrate that in many cases, the songs were relatively unchanged (A) or they were only minimally compressed with respect to rapid dynamic amplitude change (B), (C). Some of the songs had slowly fluctuating levels across the duration of the individual song, and these were modified to have more constant levels across time (D)–(F). After manipulation, all songs were delivered at the same overall level. In some cases, the total amount of energy in the song was reduced across the duration of the song (G). Finally, there was a subset of songs requiring overall level adjustment in combination with flattening across the song (H).

