
Figure 1.
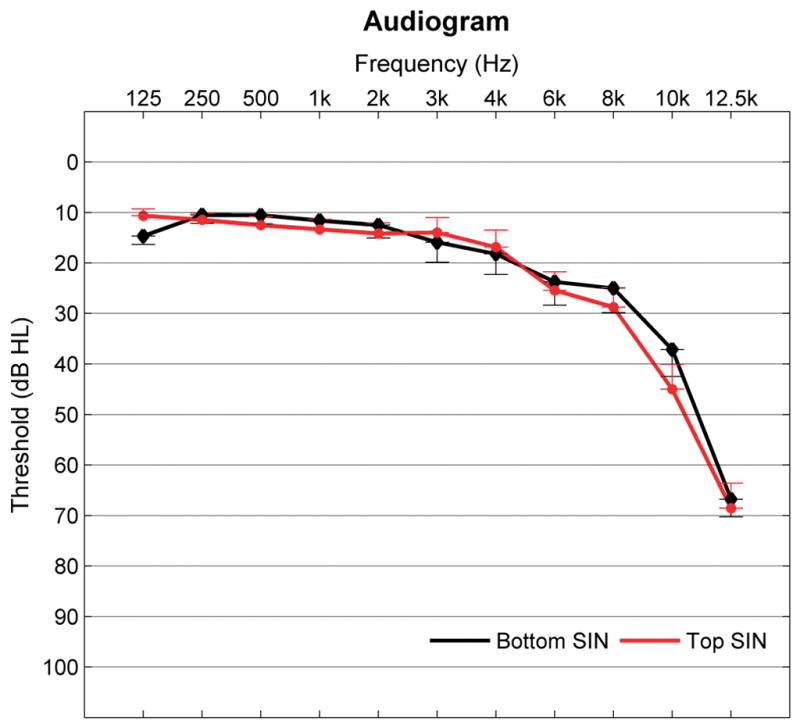
Mean pure tone thresholds (average of right and left) for top and bottom SIN groups from 125 to 12.5 kHz. No significant group differences were noted at any frequency. Error bars equal 1 standard error of measurement (SEM).
Official websites use .gov
A
.gov website belongs to an official
government organization in the United States.
Secure .gov websites use HTTPS
A lock (
) or https:// means you've safely
connected to the .gov website. Share sensitive
information only on official, secure websites.
Mean pure tone thresholds (average of right and left) for top and bottom SIN groups from 125 to 12.5 kHz. No significant group differences were noted at any frequency. Error bars equal 1 standard error of measurement (SEM).