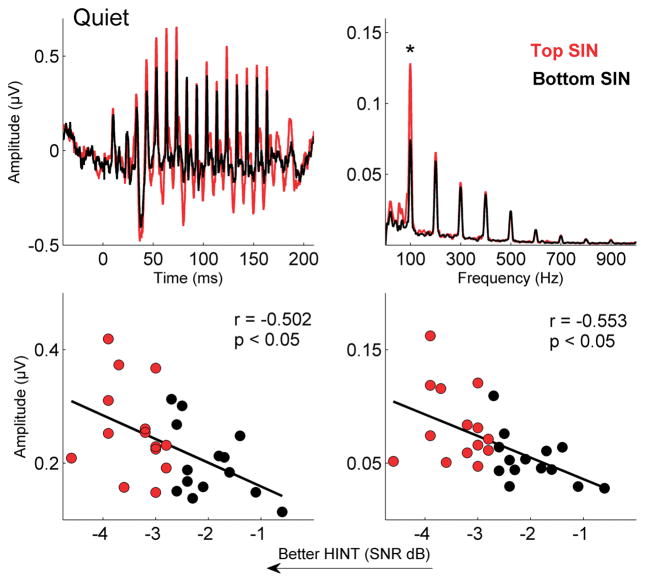
Figure 3.
Top left: Grand average responses for top (red) and bottom (black) SIN groups to the speech syllable [da] in quiet. A significant RMS difference was noted (*p = 0.039). Top right: Grand average frequency spectra with significant difference for F0 (*p = 0.010) calculated over the entire response range (5 to 190 ms). Bottom: HINT scores are significantly related to RMS (left) and F0 (right) amplitudes.

