Figure 5.
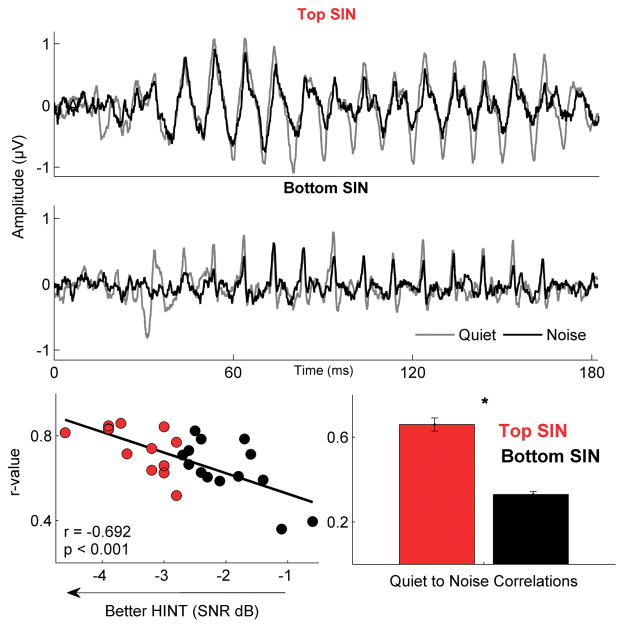
Responses in the bottom SIN group changed significantly in noise compared to those in the top SIN group. Response waveforms in quiet (gray) and noise (black) are shown for an individual in the top SIN group (top panel) and the bottom SIN group (middle panel). Bottom panel, left: HINT scores are highly correlated with quiet-to-noise correlation r-values (***p < .001) over the entire response (5 to 190 ms) Bottom panel, right: Bar graphs illustrating significant group differences in quiet-to-noise correlation r-values (p = 0.035). Error bars equal 1 SEM.

