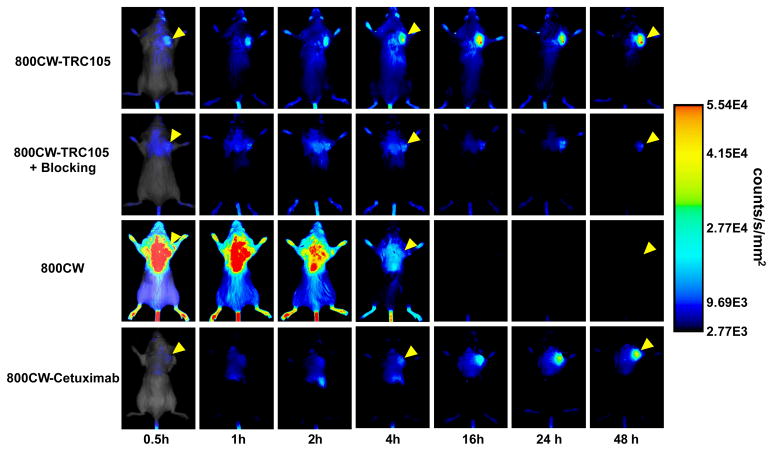
Fig. 2.
Serial near-infrared fluorescence imaging of 4T1 tumor-bearing mice after intravenous injection of 800CW-TRC105, pre-injection of a blocking dose of 2 mg of TRC105 before 800CW-TRC105 (denoted as “800CW-TRC105 + Blocking”), 800CW carboxylate, or 800CW-Cetuximab. The amount of 800CW injected into each mouse was 300 pmol and images are representative of a group of 3 mice each. All images were acquired under the same condition and displayed at the same scale. The first image in each row is a merged image of the fluorescence signal and a photo of the mouse, while subsequent images in each row are fluorescence images only. Arrowheads indicate the 4T1 tumors.

