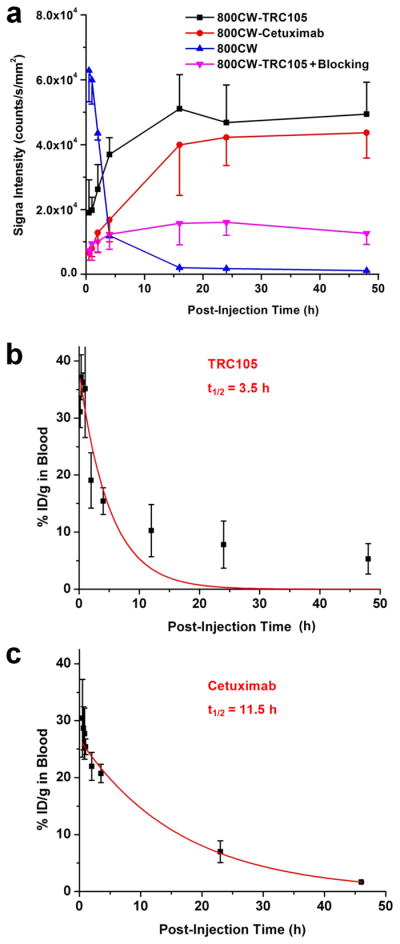
Fig. 3.

Quantitative analysis of the fluorescence data and measurement of circulation half-lives. a Average fluorescence signal intensity of the 4T1 tumor after injection of various 800CW-containing agents. Data were presented as mean ± SD (n = 3). When compared to the 800CW-TRC105 group, the P values were < 0.05 at all time points after 1 h post-injection (p.i.) for “800CW-TRC105 + Blocking”, < 0.05 at all time points for 800CW, and < 0.05 at 1 h p.i. and < 0.01 at 2 and 4 h p.i. for 800CW-Cetuximab. b The circulation half-life of TRC105 in 4T1 tumor-bearing mice is 3.5 h based on first-order exponential decay fit (shown in red) of the blood radioactivity of intravenously injected 64Cu-DOTA-TRC105. c The circulation half-life of Cetuximab in 4T1 tumor-bearing mice is 11.5 h based on first-order exponential decay fit (shown in red) of the blood radioactivity of intravenously injected 64Cu-DOTA-Cetuximab.
