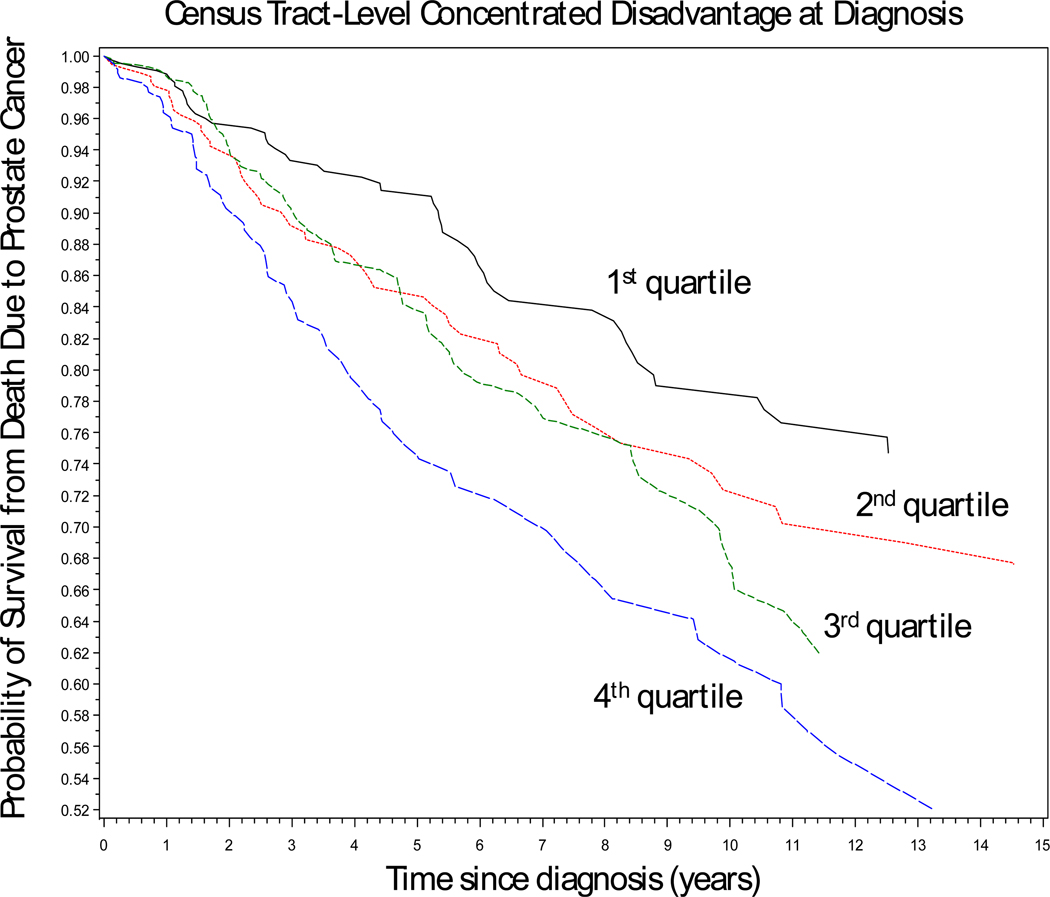
Figure 1.
Log-log plot of prostate cancer-specific survival for 833 men diagnosed with prostate cancer between 1986 and 1990 stratified by quartile of census tract-level concentrated disadvantage at diagnosis: Chicago Metropolitan Area (p-trend = 0.006). The individual survival curves are adjusted for race/ethnicity, age, tumor characteristics, first-course treatment, Charlson comorbidity score, and healthcare system (private sector vs. Veterans Health Administration), and treatment date.

