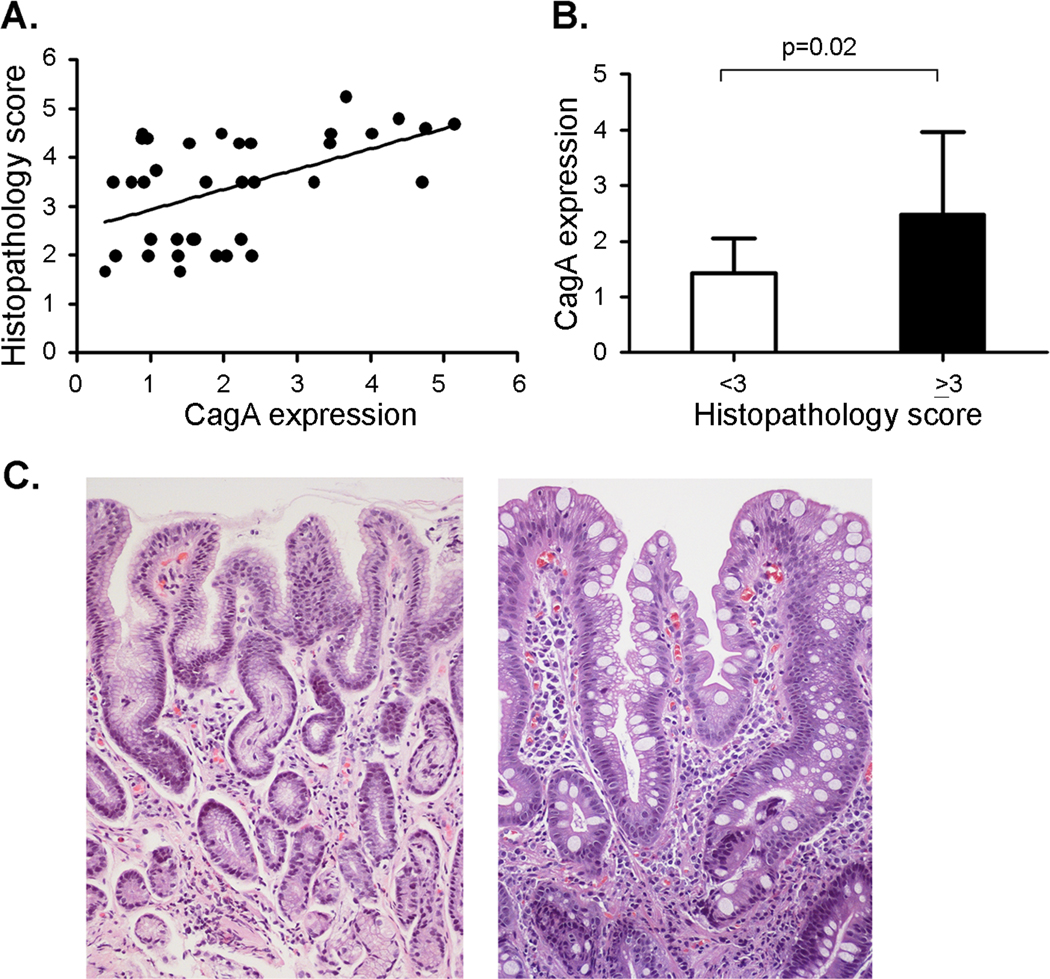
Figure 5. Relationship between levels of CagA expression and gastric histopathology score.
A. Levels of CagA expression in individual strains were analyzed by immunoblotting, and CagA expression in each strain is expressed as signal intensity relative to a standard (strain 5001). Spearman rank order correlation analysis (Sigma stat) indicated that there was a significant correlation between CagA expression levels and the corresponding gastric histopathology scores (Rs = 0.453, p = 0.0057). B. The average CagA expression was calculated for H. pylori strains associated with histology scores < 3 (non-atrophic gastritis, n= 13 strains) or ≥ 3 (precancerous lesions, n=23 strains). p-values were calculated using t-test. Mean ± standard deviation is shown. C. Representative micrographs of H & E-stained gastric tissues. Left panel is from a subject with non-atrophic gastritis (histopathology score 1.67) infected with strain 5005 (Hp Africa1 MLST type, low CagA expression). Right panel is from a subject with intestinal metaplasia (of mixed complete and incomplete types, and histopathology score 4.8) infected with strain 5082 (European MLST type, high CagA expression). In the center of the micrograph there are 2 glands. One (on the left) displays intestinal metaplasia of the incomplete type, with irregular mucus goblets and absence of a brush border; the other one (on the right) is of the complete type with regular mucus goblets and a well-defined brush border. Magnification 200×.

