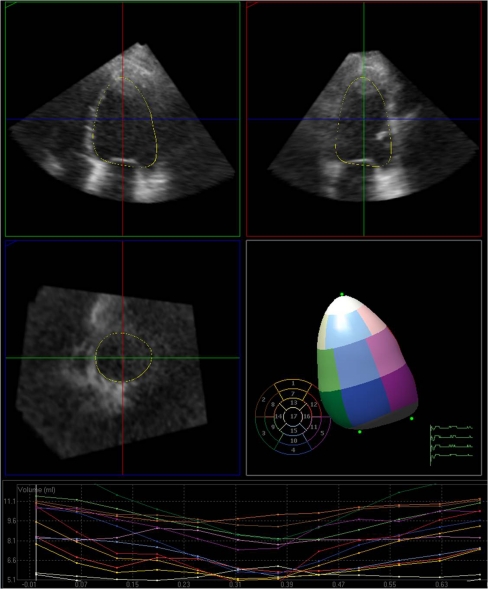
Fig. 1.
Example of the work flow of one of the commercially available software packages. Top, left and right: two perpendicular long-axis images of the LV. The endocardial contour is detected semi-automatically and is projected on the image. Centre left: a third perpendicular short-axis image, again with the endocardial contour. Note that this short-axis image was made with the ultrasound transducer in the apical position. Centre right: The LV ‘cast’ is shown with colour-coding of individual LV segments. Bottom: For each LV segment, a time-volume curve is generated. Regional wall motion and dyssynchrony can be appreciated easily

