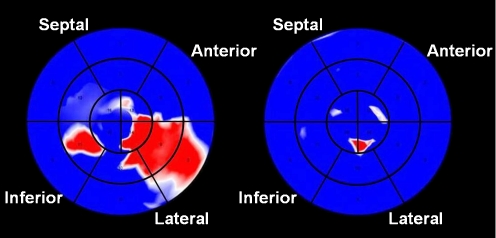
Fig. 2.
Parametric images derived from three-dimensional datasets. Images of a patient are shown with CRT turned off (left) and on (right), respectively. The LV is divided into 16 segments as described by the American Society of Echocardiography. Colour coding is used to represent regional time-to-minimum systolic volume, with red indicating late activation. In the left hand map, the lateral wall is identified as the latest activated LV region without CRT (left). As can be appreciated in the right hand map by the overall homogenous blue colour indicating the absence of large regions with delayed contraction, synchronicity is re-established when CRT is applied (right)

