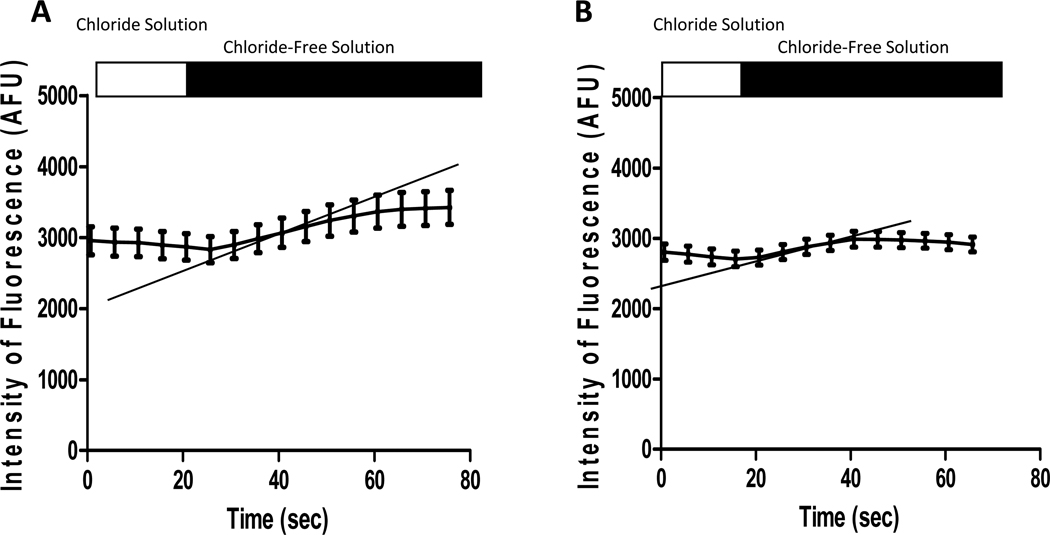
Figure 1. Representative tracings of MQAE fluorescence in WT and cftr−/− macrophages following transition to Cl−-free solution.
All macrophages demonstrate an increase in MQAE fluorescence (AFU) in Cl−-free solution as Cl− exits the cell. The rate of change in fluorescence (i.e. slope: ΔAFU/Δs) represents Cl− efflux (shown with the gray lines). The data depicts the mean ± SEM values from 20 WT (A) and 31 cftr−/− macrophages (B).

