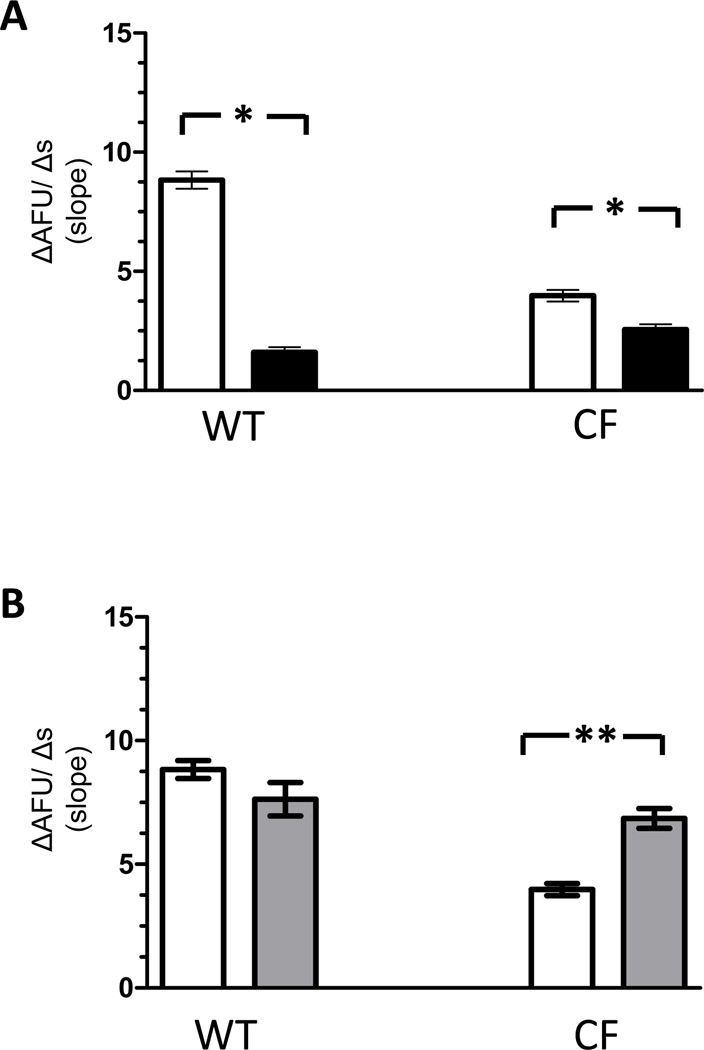
Figure 5. Cl− efflux in WT and CF macrophages assessed in low and high extracellular Ca2+ solutions.
A) Both WT (n= 95 cells from 8 mice) and CF (n= 213 cells from 7 ΔF508/ΔF508 and 7 cftr−/− mice) macrophages demonstrate a significant reduction in Cl− efflux in low Ca2+ solution (■) compared with control solution (□). *p<0.0001 B) Cl− efflux is increased in CF macrophages (n= 192 from 5 ΔF508/ ΔF508 and 5 cftr−/− mice) in high Ca2+ solution ( ) compared with control solution (□). Similar changes are not present in WT macrophages (n= 96 from 6 mice). **p=0.0002

